


Jan 07, 2007
Technology Review: IBM's InfoViz software predictions
Technology Review interviewed Kristof Kloeckner, the vice president of strategy and technology for IBM's software group, to find out how software can be used to help people and businesses cope with the increasing amount of information, and how software will evolve as that information grows more complex.
Read the full interview
23:24 Posted in Information visualization | Permalink | Comments (0) | Tags: information visualization
Dec 15, 2006
3D RSS feed reader
Via Infoaesthetic
univeRSS is a 3D RSS feed reader for VISTA that "introduces a full-screen 3D universe where galaxies represent the folders of your RSS feed directory, and the stars are represented by the spinning cubes that hold the feed information. Size and position of the feed cubes indicate how many unread items they contain" (quoted from the Microsoft website)
Currently UniveRSS uses the RSS Feed Store managed through Internet Explorer 7. Later versions will allow you to manage the Feed Store from within the UniveRSS application.
00:03 Posted in Information visualization | Permalink | Comments (0) | Tags: information visualization
Dec 03, 2006
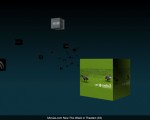
Automatic display of complex data in Second Life
Via 3D Point

SL resident Turner Boehm has developed an application that allows to automatically model the links and nodes of a complex system using SL objects. The picture above shows multiple interconnecting software systems represented by an automatically generated set of prims, based on information stored outside SL.
13:13 Posted in Information visualization, Virtual worlds | Permalink | Comments (0) | Tags: virtual reality, information visualization
Nov 29, 2006
Moodjam mood visualization
Via Infoaesthetic

Moodjam is an online visualization of people's moods visualized as beautiful color strips. Users can keep a record of their moods every hour, day, and weeks and share them with friends, family or co-workers.
22:19 Posted in Emotional computing, Information visualization | Permalink | Comments (0) | Tags: information visualization, emotional computing
Nov 07, 2006
TagCrowd
From the TagCrowd blog
TagCrowd is a web application for visualizing word frequencies in any user-supplied text by creating what is popularly known as a tag cloud.
Today, tag clouds are primarily used for navigation and visualization on websites that employ user-generated metadata (tags) as a categorization scheme. (Flickr is a good example.)
TagCrowd is trying to do something different.
When we look at a tag cloud, we see not only a richly informative, beautiful image that communicates much in a single glance. We see a whole new approach to text.
Potential uses for tag clouds extend far outside the online realm: as topic summaries for written works, as name tags for conferences, as resumes in a single glance, as analyses for survey data, as visual poetry; the list goes on.
In the future, TagCrowd will develop into a suite of experimental tools and tutorials that empower social and collaborative uses for tag clouds and related visualizations.
00:28 Posted in Information visualization | Permalink | Comments (0) | Tags: information visualization
Nov 05, 2006
US Presidential Speeches Tag Cloud 1776-2006
Re-blogged from IFTF's future now
A very interesting way to see the changes in rhetoric over time (you can move the slider around to see trends in word usage)

The above tag cloud shows the popularity, frequency, and trends in the usages of words within speeches, official documents, declarations, and letters written by the Presidents of the US between 1776 - 2006 AD.
The dataset consists of over 360 documents downloaded from Encyclopedia Britannica and ThisNation.com.
22:15 Posted in Information visualization | Permalink | Comments (0) | Tags: information visualization
Oct 30, 2006
Flickr Graph
Flickr Graph is an award winning application (FITC awards 2005) developed by Marcos Weskamp that explores the social relationships inside flickr.com. It makes use of the classic attraction-repulsion algorithm for graphs.

Try Flickr Graph here
15:50 Posted in Information visualization, Social Media | Permalink | Comments (0) | Tags: social network analysis, information visualization, complex networks
Sep 08, 2006
Visualization of literature trends
Via infosthetics

CiteSpace is a network data visualization technique that facilitates the detection of emerging trends and transient patterns in scientific literature.
From Infoesthetics:
CiteSpace is based on 2 concepts: "research fronts", defined as an emergent grouping of concepts & underlying research issues & "intellectual base", the network of citations & co-citations of a research front in scientific literature. the size of a node is proportional to the normalized citation counts in the latest time interval. The label size of each node is proportional to citations of the article, thus larger nodes also have larger-sized labels. the user can enlarge font sizes at will, & both the width & the length of a link are proportional to the corresponding cocitation coefficient. the color of a link indicates the earliest appearance time of the link with reference to chosen thresholds. current applications show complex patterns regarding mass extinction research & terrorism research.
11:15 Posted in Information visualization, Research tools | Permalink | Comments (0) | Tags: information visualization